Are Technology Outcomes Correlation or Causation

A client’s CFO once asked if buying the new marketing technology platform meant they could stop paying for their website and attending in-person events. It’s tempting to endow technology tools with a lot more power than they have.
I was reminded of this conversation last week.
An organization decided to implement this same marketing platform. What influenced their decision wasn’t any thoughtful, targeted analysis. They made the assumption that another -- completely unrelated -- company’s success with this platform guaranteed that they too would experience the same results.
"Past Performance Is Not Indicative Of Future Results"
There’s a reason why the SEC requires this disclaimer on financial documents.
Adding any new piece of technology, no matter how robust, needs to come with a well-crafted strategic plan. Technology tools with their list of features and promises make it deceptively easy to confuse causation and correlation.
Is It Correlation or Causation?
Think about it for a minute. If you don’t start with a clear plan that includes measurable before and after metrics, it’s natural to attribute changes in performance and outcomes to these new tools.
Part of this is rooted in confirmation bias.
We need reassurance that we made the right decision. The reality is technology is complex, and we often don’t have a deep understanding of what it’s actually doing. We fill in our knowledge gaps with a combination of wishful thinking, misguided implications, and random stats.
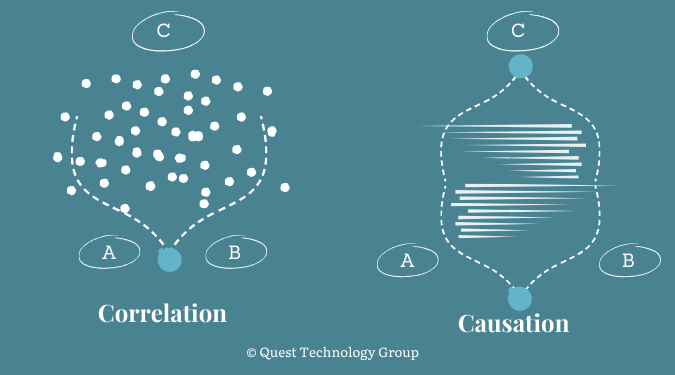
Using this marketing platform as an example, let’s say that the company experienced an increase in revenue. While it might be easy to say the tool caused the revenue boost, the truth is a bit more nuanced. Let's explore the two possibilities: correlation and causation.
1. Correlation: This means that the increase in revenue and the implementation of the new marketing platform happened at the same time, but one did not necessarily cause the other. There could be other factors at play.
For example, maybe the company hired a new business development person, they focused more closely on outreach, or they added a new service. All of these unrelated activities led to increased sales for the company.
2. Causation: This means that the new marketing platform directly led to increased revenue. In this scenario, the new helpers like a CRM, data analytics, and web forms genuinely contributed to improve sales and marketing efforts, translating to higher revenue.
If you put on your raincoat and it suddenly starts to rain, wearing the raincoat didn't cause the rain—it's a correlation.
But if you turn on the faucet and water comes out, that's causation. Your action directly resulted in the outcome.
To determine whether your results are correlation or causation, creating a matrix to measure outcomes should be part of the pre-buying process. Not only is it useful for ongoing analysis, but it clarifies the purpose of the tools before you invest.
Here’s an example of a matrix that will help track objective results for this new marketing platform. No fuzzy guesswork.
Before Implement: Record these metrics before any changes are made. This gives you a baseline to compare future data against.
After 1 Week With: After using the platform for a week, fill in these columns. This helps you measure immediate effects.
After 1 Month With: This allows you to see the impact after a longer period. Trends may become more apparent.
After 1 Week W/O: These metrics will help you measure what happens when you disable the platform for a week. Any sharp changes here could indicate causality.
After 1 Month W/O: This will give you an even clearer idea of long-term impact when the tool is not in use.
The mere occurrence of two events at the same time doesn't prove that one caused the other.
To make a sound strategic technology buying decision, you'll need to dig deeper into data, market conditions, and possibly even run experiments. Only then can you confidently say whether the new technology was the leader or just a casual bystander.
I was reminded of this conversation last week.
An organization decided to implement this same marketing platform. What influenced their decision wasn’t any thoughtful, targeted analysis. They made the assumption that another -- completely unrelated -- company’s success with this platform guaranteed that they too would experience the same results.
"Past Performance Is Not Indicative Of Future Results"
There’s a reason why the SEC requires this disclaimer on financial documents.
Adding any new piece of technology, no matter how robust, needs to come with a well-crafted strategic plan. Technology tools with their list of features and promises make it deceptively easy to confuse causation and correlation.
Is It Correlation or Causation?
Think about it for a minute. If you don’t start with a clear plan that includes measurable before and after metrics, it’s natural to attribute changes in performance and outcomes to these new tools.
Part of this is rooted in confirmation bias.
We need reassurance that we made the right decision. The reality is technology is complex, and we often don’t have a deep understanding of what it’s actually doing. We fill in our knowledge gaps with a combination of wishful thinking, misguided implications, and random stats.
Using this marketing platform as an example, let’s say that the company experienced an increase in revenue. While it might be easy to say the tool caused the revenue boost, the truth is a bit more nuanced. Let's explore the two possibilities: correlation and causation.
1. Correlation: This means that the increase in revenue and the implementation of the new marketing platform happened at the same time, but one did not necessarily cause the other. There could be other factors at play.
For example, maybe the company hired a new business development person, they focused more closely on outreach, or they added a new service. All of these unrelated activities led to increased sales for the company.
2. Causation: This means that the new marketing platform directly led to increased revenue. In this scenario, the new helpers like a CRM, data analytics, and web forms genuinely contributed to improve sales and marketing efforts, translating to higher revenue.
Here's a Simple Way To Remember Correlation vs. Causation
If you put on your raincoat and it suddenly starts to rain, wearing the raincoat didn't cause the rain—it's a correlation.
But if you turn on the faucet and water comes out, that's causation. Your action directly resulted in the outcome.
How to Remove the Hopeful (and Costly) Technology Outcomes Guesswork
To determine whether your results are correlation or causation, creating a matrix to measure outcomes should be part of the pre-buying process. Not only is it useful for ongoing analysis, but it clarifies the purpose of the tools before you invest.
Here’s an example of a matrix that will help track objective results for this new marketing platform. No fuzzy guesswork.
| Factors to Measure | Before Implement | After 1 Week With | After 1 Month With | After 1 Week W/O | After 1 Month W/O |
| Revenue | |||||
| Sales Leads | |||||
Leads Converted |
|||||
Email List Subscribers |
|||||
Customer Engagement |
|||||
Website Traffic |
|||||
Pageviews Per Visitor |
|||||
Bounce Rate |
|||||
Average Session Duration |
|||||
Search Rankings |
|||||
Social Media Followers |
|||||
Social Media Engagement |
|||||
CTR on Ads |
|||||
Customer Retention Rate |
|||||
Customer Lifetime Value (CLV) |
|||||
Net Promoter Score (NPS) |
How To Use This Results Matrix
Takeaway
The mere occurrence of two events at the same time doesn't prove that one caused the other.
To make a sound strategic technology buying decision, you'll need to dig deeper into data, market conditions, and possibly even run experiments. Only then can you confidently say whether the new technology was the leader or just a casual bystander.
Thanks for Stopping By on
Discover what other successful company leaders know.
Join our community of tech savvy business leaders. We share information, knowledge, tools, resources, and a connected community to help you and your business thrive.
 Linda Rolf is a lifelong curious learner who believes a knowledge-first approach builds valuable, lasting client relationships.
 She loves discovering the unexpected connections among technology, data, information, people and process. For more than four decades, Linda and Quest Technology Group have been their clients' trusted advisor and strategic partner.
Tags: Technology Strategy